Mastering Share of Voice Calculation
The basic math for share of voice is pretty straightforward: divide your brand's numbers by the total market's numbers, then multiply by 100. That quick calculation gives you a percentage showing how much of the conversation you actually own compared to your competitors.
Why Share of Voice Is More Than Just a Metric

A lot of marketers write off Share of Voice (SOV) as a vanity metric. You know the type—a number that looks impressive in a slide deck but doesn't feel connected to the bottom line. But that view is shortsighted. While your revenue report tells you where you’ve been, SOV is a crystal ball showing you where you're headed.
Think about it this way: a steady climb in your share of voice is often a sneak peek at a future rise in market share. It’s a leading indicator, telling you whether your marketing is actually cutting through the noise and grabbing people's attention. It's not just about counting mentions; it's about measuring your growing influence.
The Core Concept and Its Formula
At its core, share of voice is all about measuring your brand’s visibility against everyone else in your space. The foundational formula for any share of voice calculation is simple: (Your Brand Metrics ÷ Total Market Metrics) × 100.
Let's say your brand snagged 500 mentions on Instagram this month. If the total number of mentions for you and all your key competitors was 10,000, your SOV is 5%. This is what separates it from market share, which is all about historical sales data. You can dig into some more detailed examples of how this formula works over on reach-influencers.com.
Key Takeaway: Treat SOV like a compass for your marketing strategy. It points you toward untapped growth opportunities and sounds the alarm on competitive threats before they ever hit your sales numbers.
To calculate SOV effectively, you first need to decide which metrics matter most for the channels you're active on. The data you collect will vary depending on where you're measuring your presence.
Here's a breakdown of the key metrics you'll want to track for each channel:
Key Metrics for SOV Calculation Across Channels
| Channel | Primary Metric for SOV Calculation | Example Data Point |
|---|---|---|
| Social Media | Brand Mentions, Hashtag Usage, Reach | Your brand was mentioned 1,200 times on X (Twitter) in Q1. |
| Organic Search (SEO) | Keyword Rankings, Organic Traffic | Your website ranks in the top 3 for "best project management tool". |
| Paid Search (PPC) | Impression Share | Your ads appeared for 75% of all relevant searches on Google. |
| Public Relations (PR) | Media Mentions, News Coverage | Your company was featured in 5 major industry publications last month. |
| Content Marketing | Branded Search Volume, Backlinks | The number of people searching for your brand name increased by 20%. |
As you can see, the "metric" you choose is highly dependent on the channel. The key is to be consistent in what you measure for yourself and your competitors to get an accurate picture.
Unlocking Strategic Advantages
Tracking SOV isn't just an academic exercise—it gives you real, tangible benefits that can directly shape your strategy and prove your team's value. It helps you move away from fuzzy "brand awareness" goals and ties your marketing activities to outcomes you can actually measure.
Here’s how it can give your team an edge:
- Justify Marketing Spend: When you can show a direct line between a new campaign and a jump in SOV, you build a rock-solid case for your budget. It’s proof that your efforts are working.
- Spot Competitive Threats: See a sudden spike in a competitor's SOV? That’s an early warning. It could mean they just launched a new product or are pouring money into a huge campaign, giving you a chance to react before you lose ground.
- Uncover Growth Opportunities: Looking at SOV channel by channel can show you exactly where you’re falling behind—or where the competition is asleep at the wheel. If a rival has almost no voice on a platform where your audience hangs out, that's your cue to go in and dominate the conversation.
Gathering the Right Data for Your Calculation
An accurate share of voice calculation is only as good as the data you feed it. As the old saying goes, "garbage in, garbage out." Before you can even think about running the numbers, you need a solid foundation built on relevant, consistent, and well-defined information.
Your first move is to define your market realistically. It’s tempting to track every brand that even remotely overlaps with yours, but this just creates noise, not clarity. Instead, focus on a tight list of 3-5 key competitors—the ones who are truly vying for the same customer’s attention. This keeps your comparison meaningful and your data manageable.
Defining Your Market and Competitors
So, who are you really competing against? Don't just list the biggest names in your industry. Think about who your customers are comparing you to right before they make a purchase.
- Direct Competitors: These are the obvious ones. They offer a similar product to the same audience.
- Indirect Competitors: They solve the same problem your customer has, but with a totally different solution.
- Aspirational Competitors: These are the market leaders you aim to emulate or overtake. Including one can give you a useful benchmark to shoot for.
By narrowing your focus, your share of voice calculation will deliver a much sharper picture of where you actually stand in the conversations that matter most.
Choosing Your Core Metrics and Tools
With your competitive landscape mapped out, the next step is to pinpoint the exact metrics you'll track. Consistency is everything here; you must measure the same thing for your brand and for every single competitor you’ve identified. A foundational step is understanding how to calculate impressions, since this metric is central to many digital SOV calculations.
This simple, repeatable process is the key to gathering the right data without getting lost in the weeds.
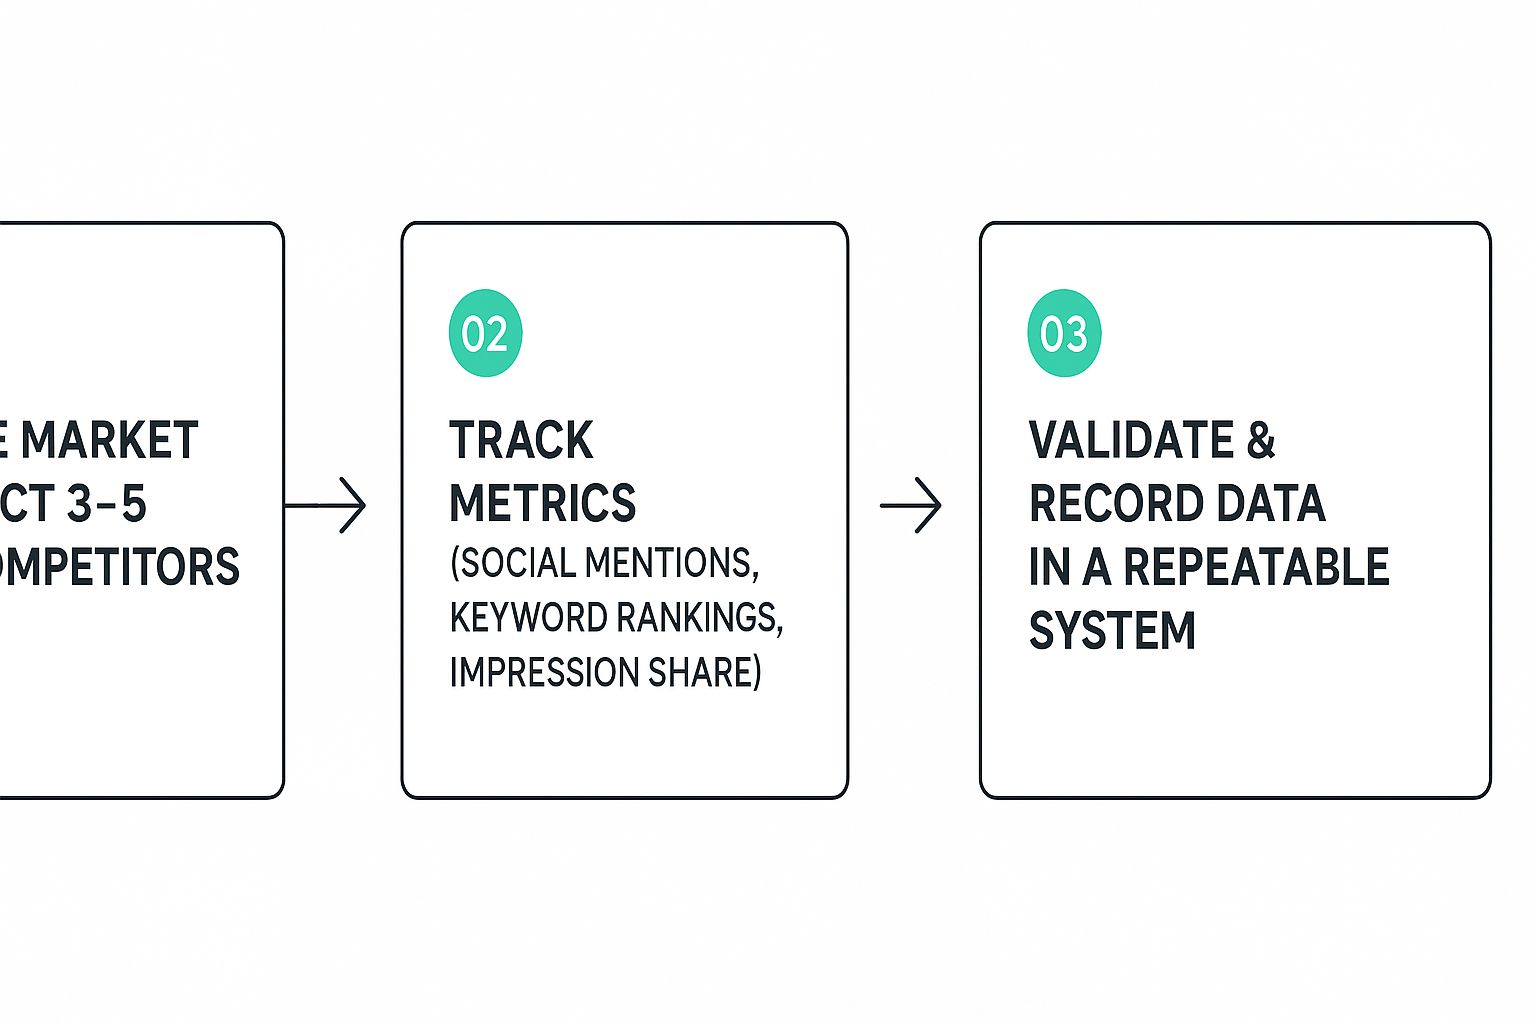
Following a system like this ensures your data collection is methodical, which prevents errors and produces reliable insights for your final calculation.
For social media, tracking brand mentions is an incredibly powerful metric. We've seen that top brands often secure at least a 20-30% share of total mentions in their industries. For instance, if your brand gets 20,000 mentions in a market where there are 200,000 total mentions flying around, your SOV is 10%.
To track these conversations effectively, you need the right tools. Intently is designed for exactly this, helping you monitor mentions and sentiment across platforms like Reddit and X. Effective social media reputation monitoring is not just about counting mentions but actually understanding the context and feeling behind them.
Pro Tip: Set up a simple spreadsheet or use a dedicated dashboard to log your data at regular intervals (like weekly or monthly). This creates a historical record, allowing you to track trends and measure the impact of your marketing campaigns over time. A repeatable system is your best defense against inconsistent or unreliable data.
How to Perform a Share of Voice Calculation

This pie chart is a great way to visualize SOV—it literally shows you how the market conversation is sliced up among competitors. A bigger piece of the pie means your brand has a stronger presence and more visibility where it counts.
Alright, you've gathered your data and know who you're up against. Now it's time to actually calculate your share of voice. The core formula is refreshingly simple: (Your Brand Metric / Total Market Metric) x 100. While the formula itself doesn't change, the specific metrics you plug in will depend entirely on the channel you're measuring.
Let's walk through some practical, real-world scenarios you can use.
We’ve come a long way from just counting media mentions in newspapers. Modern SOV analysis pulls from multiple data streams, giving you a real-time view across social media, SEO, and paid ads. For instance, you might discover you have a 15% SOV on Facebook but only 5% on X. That kind of insight immediately tells you where to focus your marketing firepower.
Calculating SOV for Organic Search
For organic search, it’s all about measuring your visibility on the search engine results page (SERP) for the keywords that matter most to your business. A great way to do this is by combining click-through rate (CTR) with search volume.
Let's imagine you run a project management software company. One of your money keywords is "best agile tools," which gets around 10,000 searches every month.
Here’s what the math might look like:
- Your Brand: You're ranking #1 (which has an estimated 28.5% CTR). That brings in about 2,850 visits.
- Competitor A: They’re at #3 (around 11% CTR), getting roughly 1,100 visits.
- Competitor B: They're sitting at #5 (about 6.1% CTR), pulling in 610 visits.
The total tracked traffic for this keyword among the three of you is 4,560 visits.
Calculation: (2,850 / 4,560) x 100 = 62.5% SOV
What does this tell you? For this high-intent keyword, you're absolutely crushing it and capturing most of the organic traffic. If you repeat this process for your top 10-20 keywords, you'll have a solid picture of your overall SEO SOV.
Calculating SOV for Social Media
On social media, the most straightforward metric is usually brand mentions. This method tracks the raw volume of conversation happening around your brand compared to your competitors. Tools like Intently are designed to monitor these conversations, but they go a step further by analyzing intent—a game-changer for B2B marketers.
Let's say you're in the B2B tech industry. Over a single month, you track the following:
- Your Brand: 1,500 mentions
- Competitor A: 2,500 mentions
- Competitor B: 1,000 mentions
The total market chatter adds up to 5,000 mentions.
Calculation: (1,500 / 5,000) x 100 = 30% SOV
This simple calculation makes it crystal clear that Competitor A is dominating the social conversation. That's a powerful insight that can help shape your content strategy—maybe it’s time to launch a campaign to generate more buzz or engage more directly with your audience. Tracking mentions can also uncover high-intent leads, a topic we dive into in our guide to https://intently.ai/blog/the-complete-guide-to-ai-lead-generation-tools.
Calculating SOV for Paid Media
When it comes to paid advertising, the gold standard is impression share. This metric is typically available right inside platforms like Google Ads and tells you exactly what percentage of potential ad views you actually captured.
Imagine you're running a Google Ads campaign. The data looks like this:
- Your Impression Share: 45%
- Competitor A Impression Share: 30%
- Competitor B Impression Share: 15%
- Lost Impression Share (to others): 10%
The total available impressions are 100%.
Calculation: (Your 45% / Total 100%) x 100 = 45% SOV
This means your ads are being shown for 45% of all available searches for your target keywords. That’s a strong position, suggesting your budget is healthy and your campaigns are well-optimized. If you want to go deeper into measuring market presence, it's worth learning about the digital shelf Share of Visibility as well.
Turning Your SOV Insights Into Action

Getting your share of voice calculation is a solid first step, but let's be honest—the number itself is just a starting point. The real magic happens when you figure out what to do with it. Think of your SOV report as a strategic map, showing you where you're leading and, more importantly, where your competitors are eating your lunch.
Turning this data into a concrete plan is what separates the brands that grow from the ones that stagnate. You need to look for trends. Is your voice getting louder, quieter, or just staying flat over time? That historical context turns a static number into a story about your position in the market.
Where Are You Winning (and Losing)?
Your SOV report will almost certainly be a mixed bag. You might be crushing it in organic search but feel like a ghost on social media. That's completely normal, and it’s the perfect place to start thinking strategically.
Begin by asking a few sharp questions:
- Where are we strongest? Find the channels where your SOV is highest and dig into the why. Did a certain content campaign just click with your audience? Is your SEO strategy finally paying dividends? Whatever is working, it's time to double down.
- Where are we falling behind? Pinpoint the channels where your SOV is low. Is a competitor simply outspending you on ads? Are they running circles around you with community engagement on X? This is where you'll find your most urgent vulnerabilities.
- Any surprises in the data? Sometimes, you’ll uncover something totally unexpected. Maybe a smaller competitor owns the conversation on a niche forum you weren't even tracking. These are often the best hidden opportunities.
This kind of analysis helps you move past simply knowing your SOV to understanding the "why" behind it. That's the key to making smarter marketing decisions and generating more qualified leads. If you're looking for fresh ideas on finding prospects, our beginner's guide to B2B lead generation has a ton of great advice.
Building Your Action Plan
Once you’ve got a handle on your position, you can create specific playbooks for different scenarios. Your response shouldn't be a shot in the dark; it should be a direct counter to what the data is telling you. A low social media SOV needs a totally different game plan than a low paid search SOV.
Key Insight: Don't treat all SOV metrics the same. A 5% share of voice in a hyper-competitive paid search market could be a massive win, while a 20% SOV on a niche social platform might just be the bare minimum. Context changes everything.
Here’s a practical way to think about translating your analysis into specific strategic actions. The table below outlines a few common scenarios and what you can do about them.
Strategic Actions Based on SOV Analysis
| SOV Scenario | Potential Implication | Recommended Action |
|---|---|---|
| Low Social Media SOV | Competitors are more engaging or have a stronger community. Your brand isn't part of the key conversations. | Launch a user-generated content campaign, increase your engagement rate with followers, and use a tool like Intently to find and join relevant discussions. |
| High Organic Search SOV | Your SEO and content strategy are effective, making you a trusted authority in your niche. | Protect your position by refreshing top-performing content. Target long-tail keywords to capture even more traffic and expand your topical authority. |
| Low Paid Search SOV | Competitors are likely outbidding you or have better ad copy and landing pages. | Conduct a competitor ad analysis. Refine your keyword targeting, improve your Quality Score, and test new ad creative to boost your impression share. |
Ultimately, this analysis gives you a dynamic guide. Use it to decide where your budget should go, what your team should focus on next, and how to make informed decisions that grow your brand’s presence in the conversations that actually matter.
Common SOV Calculation Mistakes to Avoid
Even with the best intentions, a bad share of voice calculation can send your whole marketing strategy down the wrong path. If you want accurate insights, you have to steer clear of a few common but critical mistakes that can easily warp your results and lead to bad decisions.
One of the most frequent errors I see is tracking way too many competitors. It’s tempting to cast a wide net, but including every brand in your space just creates noise, not clarity. Your calculation gets diluted, and you lose focus on the rivals who are really fighting for your customer’s attention.
My advice? Stick to your top 3-5 direct competitors. This gives you a much sharper, more actionable comparison.
Another major pitfall is tunnel vision—focusing only on a single channel. Dominating organic search is great, but what if your competitors own the conversation on social media? You're left with a massive blind spot. A real understanding of your market position demands a multi-channel view. Without it, you’re only seeing a tiny piece of the puzzle.
Inconsistent Metrics and Bad Data
Using inconsistent metrics is another guaranteed way to get an inaccurate number. If you measure your SOV using brand mentions but track a competitor’s using hashtag usage, you aren’t making an apples-to-apples comparison. The data becomes totally meaningless.
You have to apply the exact same metric across all brands for every channel you measure. This consistency is the bedrock of a reliable calculation.
On top of that, relying on flimsy or incomplete data will completely undermine your efforts. If your tool only scrapes a small fraction of social media conversations or uses outdated search volume numbers, your final SOV figure will be a guess at best.
Key Takeaway: A share of voice calculation isn't a one-time project; it's a continuous health check for your brand. Treating it as a static snapshot from a single moment means you’ll miss crucial trends and competitive shifts as they happen.
Ignoring Qualitative Context
Finally, a purely quantitative approach misses half the story. A high volume of mentions doesn't mean much if the sentiment behind them is overwhelmingly negative. A sudden spike in SOV could easily be from a PR crisis, not a successful marketing campaign.
You should always layer sentiment analysis on top of your volume metrics. Tools like Intently are built to distinguish between positive, negative, and neutral conversations, giving you the context needed to understand why people are talking about you. This qualitative insight turns a simple number into genuine market intelligence, ensuring your share of voice calculation reflects your brand’s actual standing with customers.
Got Questions About SOV? We’ve Got Answers.
When you first start digging into share of voice, it’s easy to get tangled up in the details. It’s a powerful metric, but let's be honest, the specifics can be a bit confusing. We hear the same questions pop up all the time.
Let’s clear up any lingering confusion so you can put this guide into practice with confidence. Think of this as your final checklist before you start running the numbers.
Isn’t SOV Just Another Name for Market Share?
This is probably the most important distinction to get right. While the two are definitely related, they measure fundamentally different things, and one often predicts the other.
Market share is a look in the rearview mirror. It tells you about past performance by measuring your company's sales as a percentage of total industry sales. It’s all about revenue and what’s already happened.
Share of Voice (SOV), on the other hand, is like a crystal ball. It measures your brand's presence in the market conversation before a sale happens. A rising SOV often signals future growth in market share, making it an incredible predictive metric for your marketing efforts.
How Often Should I Actually Calculate This?
There's no single magic number here—it really depends on how fast your industry moves and what your campaign cycle looks like. As a solid rule of thumb, aim to run a full share of voice calculation quarterly.
This gives you enough data to spot meaningful trends without getting lost in the noise of daily fluctuations. Now, if you’re in a super fast-paced industry or in the middle of a huge product launch, you might want to check in monthly or even weekly to keep a closer pulse on things. The real key is just being consistent.
What Are the Best Tools for Measuring SOV?
Good news: you don’t need a massive software budget to get started. Plenty of user-friendly tools can help you gather the data you need without a steep learning curve.
Here are the types of tools you’ll want to look at:
- Social Listening Tools: Platforms like Intently are built to monitor brand mentions, track competitor conversations, and find keywords across channels like Reddit and X. They are absolutely essential for understanding the social conversation side of SOV.
- SEO Platforms: Tools like Ahrefs or Semrush are perfect for tracking keyword rankings and organic traffic against your competitors. This is your go-to for getting an accurate SEO SOV.
- PPC Dashboards: For paid ads, the data is usually right there in front of you. Google Ads and other platforms give you the crucial "Impression Share" metric directly in their reporting dashboards.
Honestly, the best approach is to use a mix of these. That’s how you’ll build a complete, multi-channel picture of where you really stand in your market.
Ready to stop guessing and start measuring your true impact on social channels? Intently gives you the power to track brand mentions, monitor competitor chatter, and find high-intent leads in the conversations that matter most. Get a clear picture of your share of voice and turn insights into action. Discover your SOV with Intently today.