Calculating Share of Voice: See Your Brand's Market Edge
Calculating your Share of Voice isn't just about stroking your brand's ego—it's a hard-nosed predictor of market share and overall brand health. It tells you how much of the conversation in your market you actually own compared to your competitors.
Getting a handle on this number is the first step toward shaping a smarter strategy, whether you're tweaking ad spend or rethinking your competitive positioning.
Why Share Of Voice Is A Crucial Growth Metric

Before we get into the math, it's important to think about SOV differently. It's not a report card. It's more like a diagnostic tool that helps you see the competitive landscape clearly.
It answers one simple, powerful question: When customers think about my product category, how likely are they to think of my brand? The answer to that question has a direct line to purchasing decisions and long-term loyalty.
The Power Of Visibility In Practice
Let's imagine two competitors in the crowded project management software space. Brand A is obsessed with tracking its SOV across organic search, social media, and paid ads. Brand B, on the other hand, is laser-focused on conversion rates from its existing campaigns, completely ignoring the bigger picture.
Brand A digs in and discovers its SOV in organic search for "agile workflow tools" is a measly 5%, while a major competitor is dominating the conversation at 30%. This single insight gives them a clear mission: invest in targeted content and SEO to start chipping away at that competitor's lead.
Meanwhile, Brand B is scratching its head, wondering why lead volume has flatlined despite their ad campaigns looking successful on paper.
This scenario shows exactly why SOV is so important. It provides the context that raw performance metrics can't give you. It’s a fundamental piece of brand health tracking, showing you where you’re winning, where you’re losing, and—most critically—where the real growth opportunities are hiding.
To calculate SOV, you first need to identify the right metrics for each channel you care about. These are the data points you'll be gathering for both your brand and your competitors.
Here’s a quick breakdown of what to look for:
Key Metrics for Calculating Share of Voice
| Channel | Primary Metric | Example Data Point |
|---|---|---|
| Organic Search | Keyword Rankings / Impressions | Your brand ranks #3 for "CRM software" |
| Paid Search (PPC) | Impression Share | Your ads show up for 45% of relevant searches |
| Social Media | Brand Mentions / Hashtag Usage | Your brand was mentioned 1,200 times last month |
| Public Relations | Media Mentions | Your company was featured in 5 industry articles |
| Content Marketing | Branded Search Volume | 10,000 people searched for your brand name |
This table isn't exhaustive, but it gives you a solid starting point for the kind of data you'll need to pull together. The key is to pick a metric and apply it consistently across all competitors you're tracking for a given channel.
Understanding Extra Share Of Voice
The concept gets even more interesting when you start looking at Extra Share of Voice (ESOV). This is simply the difference between your SOV and your actual market share. Why does this matter? Because landmark research has proven a direct link between a higher SOV relative to market share and sustained business growth.
Research from Nielsen analyzing 1,700 campaigns found that for every 10% of ESOV a brand has, its market share grows by an average of 0.5%. This proves that out-talking your current market position is a reliable path to growth.
This connection cements SOV's role as a leading indicator, not a lagging one. It doesn’t just report on past performance; it helps you predict where your brand is headed next.
How to Gather Your Data for SOV Calculation
Your Share of Voice calculation is only as good as the data you feed it. Think of it like this: if your data is shaky, your results will be, too. Each data point is a clue, helping you piece together the puzzle of where you truly stand in the market.
First things first, you need to know who you’re up against. This isn’t just about the big household names. You also need to keep an eye on the nimble upstarts actively chasing the same customers you are.
Once you have a clear list of rivals, it’s time to start collecting the data. This isn’t a one-size-fits-all job; the metrics you need will shift depending on the channel you’re looking at.
Sourcing Paid and Organic Search Data
When it comes to your paid advertising, finding the right data is usually pretty straightforward. Platforms like Google Ads and Meta Business Suite give you direct access to the most important metric for calculating your share of voice here.
Paid Search (PPC): The magic metric is Impression Share. You can pull this number right from your Google Ads account, usually under a section for competitor metrics. It tells you the percentage of possible ad impressions you actually received compared to what you were eligible for. Simple as that.
Organic Search (SEO): This one takes a bit more digging and requires dedicated SEO tools. Platforms like Semrush or Ahrefs are indispensable for measuring your organic visibility. They help you track rankings and estimate traffic for a specific set of keywords, showing you exactly how you stack up against the competition in search results.
Here’s a great example of how a tool might visualize your organic slice of the pie for a certain group of keywords.
This chart gives you a quick, at-a-glance breakdown of search visibility, making it instantly clear who's winning the organic conversation.
Capturing Social and Media Conversations
Beyond search, you need to tune into the unstructured chatter happening across social media and the wider web. This is where brand mentions and media coverage become your key data points.
Social listening is absolutely non-negotiable for this piece of the SOV puzzle. Tools like Brandwatch or our own platform, Intently, are built to track mentions of your brand, your competitors, and important industry keywords across millions of online sources. The data you get is a direct measure of who is dominating the social discourse.
If you want to go deeper on this, check out our https://intently.ai/blog/social-listening-report, which breaks down some really effective strategies.
Key Takeaway: Don’t just tally up the mentions. You have to pay attention to the context and sentiment behind them. A huge volume of negative mentions tells a completely different story than a stream of positive ones.
To really nail down the foundational steps and make sure your SOV numbers are solid, it’s worth checking out a comprehensive guide on how to calculate your brand's Share of Voice. This resource can help you get your approach locked in before you dive into the numbers. By systematically grabbing data from each of these channels for both your brand and your competitors, you’re building the solid foundation you need for a truly insightful calculation.
Calculating Your Share of Voice Across Channels
Alright, you've lined up your data sources. Now it's time to turn those raw numbers into something you can actually use. This is where we get into the nuts and bolts of the core Share of Voice formula and see how it works in the real world.
The fundamental formula is refreshingly simple:
(Your Brand Metric / Total Market Metric) * 100 = Your Share of Voice (%)
This little equation works for any channel, as long as you're consistent and apply the same metric to your brand and everyone else you're tracking. Let’s walk through a scenario with a fictional SaaS company, "ConnectSphere," to see this in action.
This visual flow shows the core process—you have to define your metrics and source the data before you can even think about the final calculation.
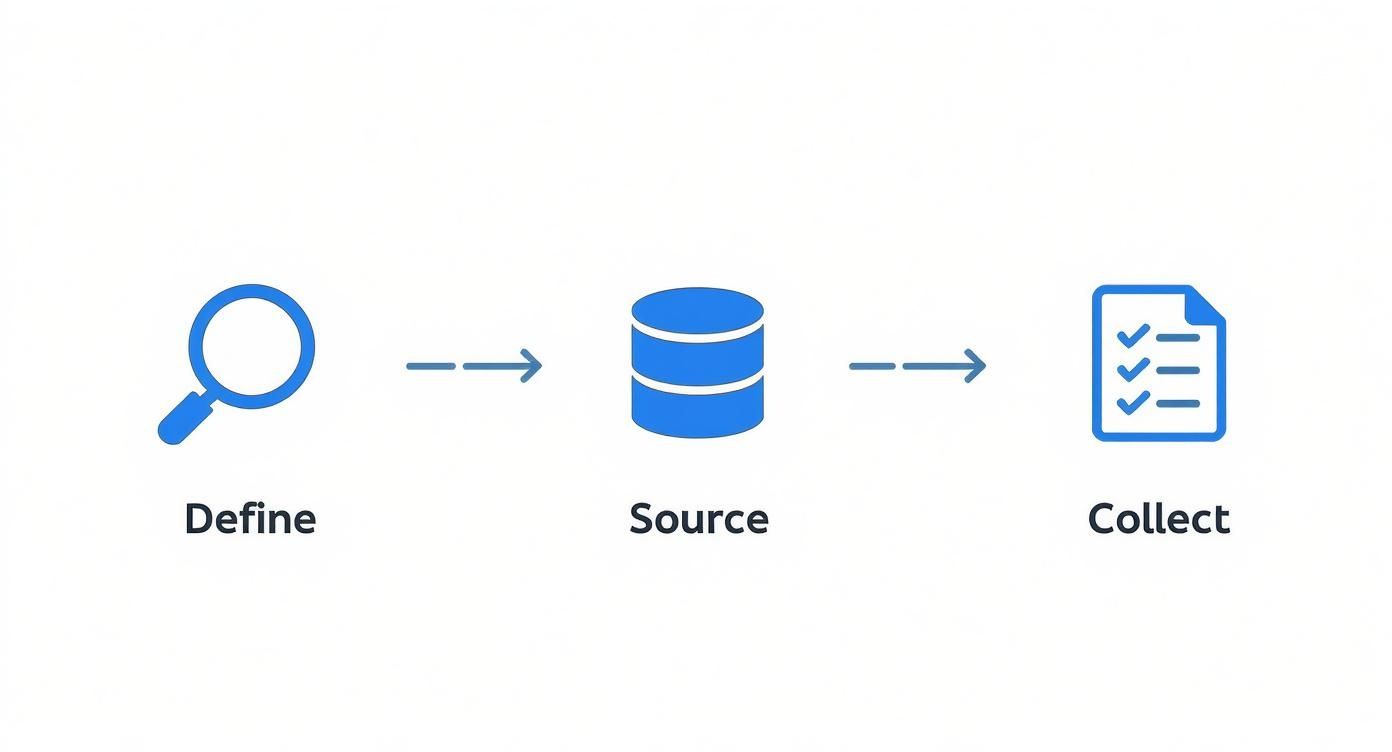
As you can see, a successful calculation starts long before you open a spreadsheet. It all begins with clear definitions and reliable data gathering.
Calculating Organic Search SOV
For organic search, a solid metric to use is keyword visibility or the estimated traffic from a specific group of high-value keywords. Let's imagine ConnectSphere and its three main competitors are all going after a basket of 50 keywords related to "team collaboration software."
Using an SEO tool, they pull the following monthly traffic estimates from this keyword set:
- ConnectSphere: 8,000 visits
- Competitor A: 15,000 visits
- Competitor B: 10,000 visits
- Competitor C: 7,000 visits
First, we need the Total Market Metric, which is just the sum of all visits: 8,000 + 15,000 + 10,000 + 7,000 = 40,000 total visits.
Now, we can plug ConnectSphere's number into the formula:
(8,000 / 40,000) * 100 = 20%
Boom. ConnectSphere has a 20% share of voice in organic search for their target keywords. This single number gives them a clear benchmark to measure their SEO performance against.
Calculating Paid Search SOV
When it comes to paid search, the most direct metric is Impression Share, which you can find right inside Google Ads. It tells you the percentage of times your ads were shown out of the total number of times they could have been shown. It's clean and straightforward.
Let's say the total available impressions for ConnectSphere's target keywords last month was 500,000.
- ConnectSphere's Impression Share: 25% (or 125,000 impressions)
- Competitor A's Impression Share: 40% (or 200,000 impressions)
- Competitor B's Impression Share: 20% (or 100,000 impressions)
- Competitor C's Impression Share: 15% (or 75,000 impressions)
In this case, the calculation is already done for you. ConnectSphere holds a 25% SOV on the paid search front. This clearly shows they're being outspent or out-optimized by Competitor A, who is dominating the ad space.
Pro Tip: When you're calculating SOV, make sure you've accurately identified all the relevant competitors. Missing even one active player can seriously skew your results and give you a false sense of security. Effective competitive intelligence gathering is the bedrock of any accurate SOV analysis.
Calculating Social Media SOV
For social media, we'll use brand mentions as our metric. Using a social listening tool, ConnectSphere tracks mentions of their brand and their competitors across X and LinkedIn over the last 30 days.
The tool spits out the following mention counts:
- ConnectSphere: 1,200 mentions
- Competitor A: 2,500 mentions
- Competitor B: 1,500 mentions
- Competitor C: 800 mentions
Again, we find the Total Market Metric by adding them all up: 1,200 + 2,500 + 1,500 + 800 = 6,000 total mentions.
Finally, we apply the formula one last time:
(1,200 / 6,000) * 100 = 20%
So, ConnectSphere also has a 20% share of voice on social media. This hands-on framework gives you a repeatable process to measure what actually matters. If you want to go deeper on the specific methods, other resources offer practical steps to calculate your Share of Voice.
Turning SOV Numbers into Actionable Insights
So you've calculated your Share of Voice. You have a number. Now what? A raw percentage doesn't tell a story on its own. The real magic happens when you interpret what that number means for your business and turn it into confident, strategic decisions.
An SOV of 15% might feel low, but context is everything. If you're a scrappy startup in a market dominated by three legacy giants, grabbing 15% of the conversation could be a massive victory.
On the flip side, if you're the established market leader, a slip from 45% to 35% is a major red flag that demands immediate attention. It’s all about perspective.
Benchmarking Your Performance
Your first move is to benchmark your SOV against your market position and industry norms. This is what adds that crucial layer of perspective to your data.
A 2022 Sprout Social report on SOV benchmarks found that the average share of voice for the leading brand in major industries was 28%, with the top three brands often gobbling up 65% of all mentions. For example, in the fiercely competitive tech world, Apple led the pack with a 31% share of voice.
This kind of data helps you understand what a "good" SOV even looks like in your space. Are you a challenger nipping at the heels of the big players, a niche expert, or a dominant force? Your entire interpretation hinges on that answer.
A core question to ask is: Is my Share of Voice higher than my market share? If it is, you're likely on a growth trajectory. If your SOV is lower than your market share, your brand visibility is lagging, and competitors could be gaining ground.
Tracking your SOV over time is where the most powerful insights emerge. A single snapshot is useful, but a trend line is invaluable. Consistent measurement reveals the direct impact of your marketing efforts—the good, the bad, and the ugly.
To make sense of your score, you need a quick way to gauge where you stand. This table breaks down what different SOV percentages typically mean and what your next move should be.
SOV Score Interpretation Guide
| SOV Percentage | Market Position | Recommended Action |
|---|---|---|
| 0-10% | Niche Player / New Entrant | Focus on a specific niche. Identify competitor weaknesses and target underserved conversations. Punch above your weight in one or two key channels. |
| 11-25% | Challenger Brand | You're on the radar. Double down on what's working. Analyze the leaders' strategies and find gaps you can exploit to steal market share. |
| 26-40% | Market Leader | Defend your position. Monitor competitors closely for emerging threats. Innovate your content and campaigns to maintain dominance and set the agenda. |
| 40%+ | Dominant Force | You own the conversation. The goal is to maintain and expand. Explore new channels and topics to broaden your influence and prevent stagnation. |
Think of this table as a strategic compass. It doesn't just tell you where you are; it points you toward your next destination.
From Data Points to Strategic Direction
When you start analyzing your SOV trends, look for patterns and start asking the right questions. This is how you turn a simple metric into a roadmap for action.
Which channels are driving our growth? If your SOV is soaring on social media but stagnant in organic search, you know where to double down and where you need to diagnose some issues.
Where are our competitors vulnerable? Did a rival's SOV drop after they paused a major ad campaign? That's your window of opportunity to increase your spend and capture their audience.
What conversations are we missing? A low SOV in a specific topic cluster or on a certain platform indicates a blind spot in your content or community engagement strategy.
Let's say your overall SOV is 20%, but it’s only 5% on LinkedIn where key decision-makers in your industry gather. You’ve just identified a high-priority channel for your B2B marketing efforts. The goal is to always move beyond the high-level number and dissect the components that create it.
Proven Strategies to Increase Your Share of Voice

Alright, you've got your baseline Share of Voice calculated. Now the real work begins. Boosting your brand's visibility isn't about shouting louder; it's about being smarter and more intentional where your audience is already listening.
Forget the generic advice. Let’s dig into specific tactics that actually build a sustainable competitive edge and move the needle on your SOV. Growing your share of the conversation means being consistently present and, more importantly, valuable.
Dominate Search with Strategic SEO
One of the most direct ways to steal SOV from competitors is by targeting the keywords they already own. Fire up your favorite SEO tool and find high-volume keywords where a competitor ranks on the first page, but not in the top three spots. These are your low-hanging fruit.
Your goal isn't just to create better content, but 10x better content. What does that look like in practice?
- Add original data or research nobody else has.
- Weave in quotes from industry experts or interviews.
- Build a more comprehensive guide with sharper visuals and clearer examples.
By systematically picking off these "vulnerable" keywords, you directly chip away at their search visibility while bolstering your own. It's a targeted, measurable approach to winning organic SOV.
Create Content That Earns Mentions
Content is the engine of your SOV. If you want to own more of the conversation, you have to create assets that people genuinely want to talk about and share. Think beyond standard blog posts.
For instance, a data-driven report based on a survey you commissioned can become a go-to source for your entire industry. It naturally attracts backlinks and media mentions, which are direct fuel for your SOV. This kind of pillar content gives journalists, bloggers, and influencers something meaty to reference.
Key Takeaway: Don't just respond to conversations—start them. Thought-provoking content positions you as a leader, forcing competitors to react to the agenda you set. Ask tough questions, present a strong point of view, and invite others to weigh in.
Lead the Conversation on Social Media
On social, whoever starts the conversation often owns it. Instead of just reacting to trends, get out in front of them by posing insightful questions and sharing bold opinions that get people talking.
Take a B2B software company, for example. Instead of just posting product updates, they could start a weekly LinkedIn thread debating the future of their industry. This fosters a community and consistently places their brand at the heart of relevant discussions.
Here’s a simple playbook for leading social conversations:
- Identify a Hot-Button Topic: Find a subject with divided opinions in your niche.
- Take a Stance: Publish a well-reasoned post outlining your perspective.
- Ask an Open-Ended Question: Invite others to share their experiences and viewpoints.
- Engage with Every Reply: Actively moderate the discussion to keep the momentum going.
This approach turns your social media channels from broadcast platforms into vibrant community hubs, directly increasing your social SOV. The secret is consistent, authentic engagement that adds real value to the discussion.
Common Questions About Share of Voice
Even after you've got the hang of calculating share of voice, a few practical questions almost always come up. Let's walk through some of the common ones so you can track this metric with confidence and avoid a few potential headaches along the way. The goal here is consistency and clear interpretation.
How Often Should I Calculate Share of Voice?
This is easily the most frequent question I get. For fast-moving industries like e-commerce or tech, running the numbers monthly or even quarterly is pretty much essential to keep up. Things just change too fast.
But if you're in a more stable sector, a bi-annual check-in might give you everything you need. There isn't a magic number here—the key is picking a consistent schedule. You want to spot meaningful trends over time, not just react to short-term blips on the radar.
Can I Do This on a Shoestring Budget?
Another big one is cost. Do you really need to shell out for expensive tools to figure out your SOV? The short answer is no. While it won't be as precise, you can get a surprisingly strong directional sense using free resources.
Here's how you can pull it off:
- Google Trends is your best friend for comparing search interest between your brand and your competitors. It's quick, easy, and free.
- Manually track key industry hashtags on social media to get a rough count of brand mentions. It takes a bit of elbow grease, but it's doable.
- Use the free versions of popular SEO tools to monitor a small, core set of keywords.
This DIY approach won't give you the granular detail of a premium platform, but it’s a fantastic and actionable starting point for any team watching its budget.
It’s crucial to remember that Share of Voice is a leading indicator, while market share is a lagging one. SOV tells you about your brand's current visibility and who's dominating the conversation right now, which often predicts future sales. Market share, on the other hand, just tells you what percentage of past sales you've captured. A rising SOV is a powerful signal of future growth, making it a vital metric for any forward-looking strategy.
By tracking high-intent conversations where they happen, Intently gives you the power to not just measure your Share of Voice but actively grow it. See how our AI agents can find qualified leads and engagement opportunities for your GTM team at https://intently.ai.